


By the numbers: Rogers system performance
06/05/17 12:14:pmFinancial performance
(8/1/16 through 4/30/17)
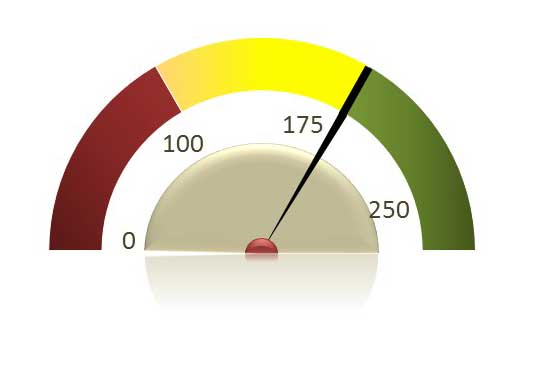
Revenue minus expenses fiscal year-to-date = $17.9 million
Target = $19.1 million
Same period last year = $19.6 million
Net revenue was $4.5 million stronger than budgeted, resulting from a favorable payer mix and improved account collection experience. Higher year-to date operating expenses offset this increased revenue with year-to-date expenses about 8% higher than plan due to increased compensation expenses and purchased service costs. The system’s credit rating was recently upgraded to A- by Standard and Poor’s.
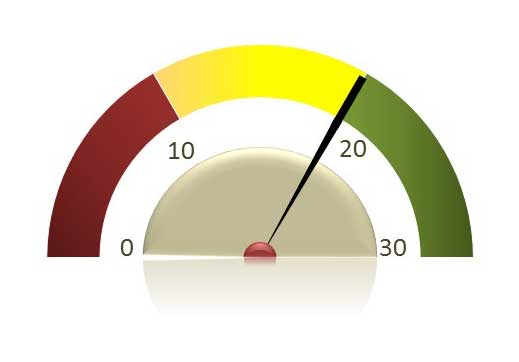
Patient days of service including inpatient, residential and outpatient = 171,332
Target = 175,197 days
Same period last year = 152,774 days
Patient service days of 59,000 in the third quarter represent a record census – the highest quarterly total in Rogers’ history. With increases in inpatient, residential, and outpatient clinic volumes, Rogers has served 12% more patients year-to-date in FY 2017 than the same period in FY 2016.
It’s important for Rogers to be financially healthy so that we can:
Bring our life-saving treatment to more patients (increase access to care with new locations and programs)
Hire, train and motivate the best employees because employees are critical to quality patient care.
Provide more care to those who can’t afford it through patient care grants
Clinical effectiveness
Clinical effectiveness as measured by the CGI Score, the clinician-rated assessment of patient severity upon admission and assessment of improvement at time of discharge.
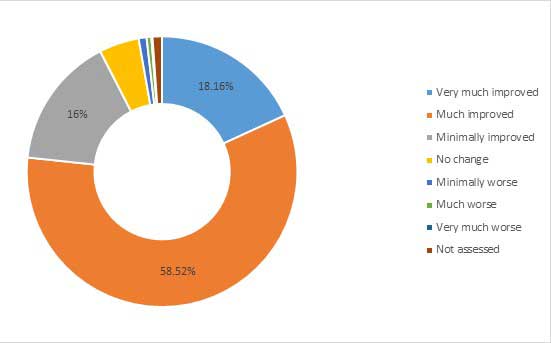
Performance to date
77% of our patients were “much improved” or “very much improved” over the course of their stay, as rated by the attending psychologist or psychiatrist. The data in the graphic represent 1,591 patients from February 1 – May 1, 2017. Because Rogers only recently began collecting CGI data, this year’s results will be used as a baseline.
Employee engagement as measured by results on the employee satisfaction survey (average of seven survey questions on satisfaction, pride, and commitment to the job and organization)
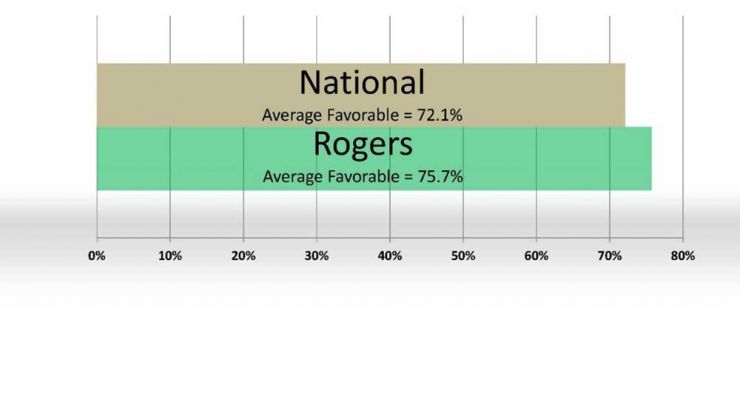
2016-17 performance
Note: Rogers’ target is to improve the employee engagement composite score by at least 3% to 78 on our 2017 survey.
Patient satisfaction as measured by Press Ganey survey results
Details of this measure and target are still under discussion in consultation with Press Ganey.